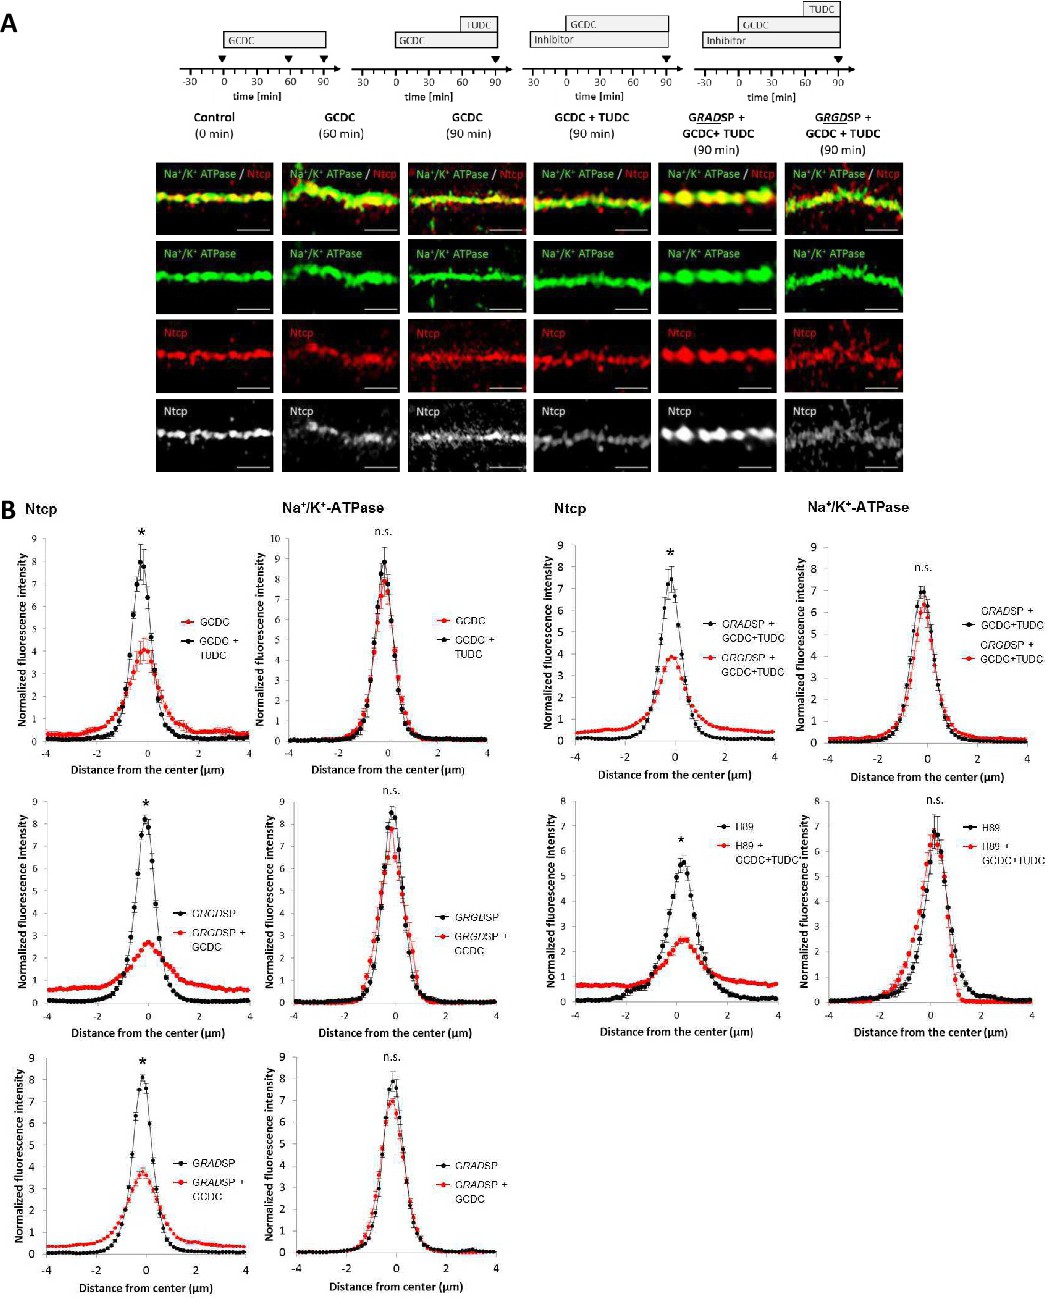
Fig. 5. TUDC reverses the GCDC-induced retrieval of Ntcp in an integrin- and PKA-dependent way. (A, B) Rat livers were perfused with GCDC (20 µmol/l), TUDC (20 µmol/l), GRGDSP (10 µmol/l), GRADSP (10 µmol/l) and/ or H89 (2 µmol/l) as indicated in the respective perfusion plans (A). Livers were fixed and Ntcp and Na+/K+-ATPase were analysed by immunofluorescence and (A) SR-SIM or (B) confocal laserscanning microscopy and Ntcp distribution was quantified as described in methods at t = 90 min. Representative images from at least 3 independent experiments are shown. The scale bars correspond to 1 µm. (B) Arithmetric means ± SEM for at least 10-30 independent measurements per animal and 3 independent experiments for each condition are shown. * statistically significantly different compared to control. n.s.: not statistically significantly different.